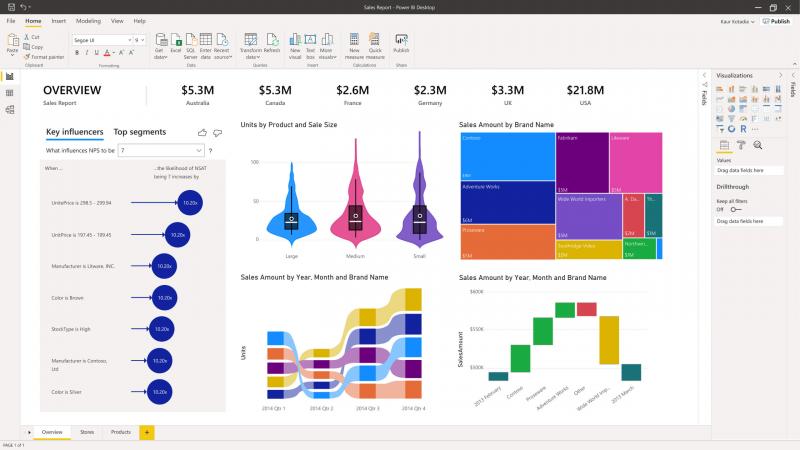
Power BI is one of the most widely used business intelligence solutions in the market because of is reporting capabilities and powerful interactive dashboards. Power BI dashboards make data visualization extremely easy for the user as they can analyze all possible business scenarios with a given dataset. The dashboards are used to visualize multiple reports at a time and the visualizations can be used for storytelling. Since dashboards are limited to just one page, they are usually used to highlight just the most important elements of the story.
Here are a few of the most significant functions and benefits of Power BI dashboards
A consolidated view of business metrics: Monitoring critical business functions is effortlessly easy with the dashboards that can be accessed even from mobile devices from any geographic location. The dashboards provide a combined view of on-premises and cloud-data, making monitoring easy and action triggering faster.
Dashboards provide a quick and easy way to monitor business metrics and initiate necessary actions.
Saves time: The enhanced visibility into different business processes enables stakeholders to respond fittingly to the rapidly evolving market dynamics. This saves the precious time of the user which they would have otherwise invested in generating tedious reports through the taxing process of data gathering and interpretation.
Power BI dashboards save significant time by drawing data from centralized sources and presenting them in easily comprehensible ways.
Better response to customer behaviour: Power BI dashboards help businesses across industries with relevant and accurate customer insights by the analysis of customer behaviour and market trends. The ability to assess the impact of marketing activities planned for the target audience helps businesses fine-tune their strategies for higher profits.
Accurate assessment of customer sentiment for better marketing efforts.
Drill-down analysis of data: Using the dashboards, users can draw actionable conclusions based on any data variable or object. The drill-up and drill-down capabilities help in the analysis of complex data at multiple levels. Users can create interactive and ad-hoc reports with drill-down reporting capabilities to work on the right dataset for finding answers to important business questions.
Insightful and quick data analysis to reduce server querying time.
Intuitive presentation of data: The user-friendly interface of Power BI dashboards eliminates the need for special skills or training to work on them. The smooth navigation of the dashboards lets users create informative business stories using the right visualization elements including charts, graphs, and maps.
There’s no need for any special training to work on the dashboards.
Performance management: One of the benefits of data visualizations is the efficient tracking of employee performance and the progress of the business towards its set goals. Setting and monitoring of suitable business process KPI templates for metrics like sales, employee target achievement, and others keep everyone on track and facilitate the efficient functioning of the business.
The dashboards help the management and managers keep organizational progress in line with the company goals.
Microsoft offers several handy tools and platforms for the creation of customized Power BI dashboards to facilitate easy business operations. The visualized summary of multiple sets of data provides an instant overview of all critical areas of the business.
